Guide to AP Pre Calculus Success
Unit 3
3.1 Periodic Phenomena
3.1.A
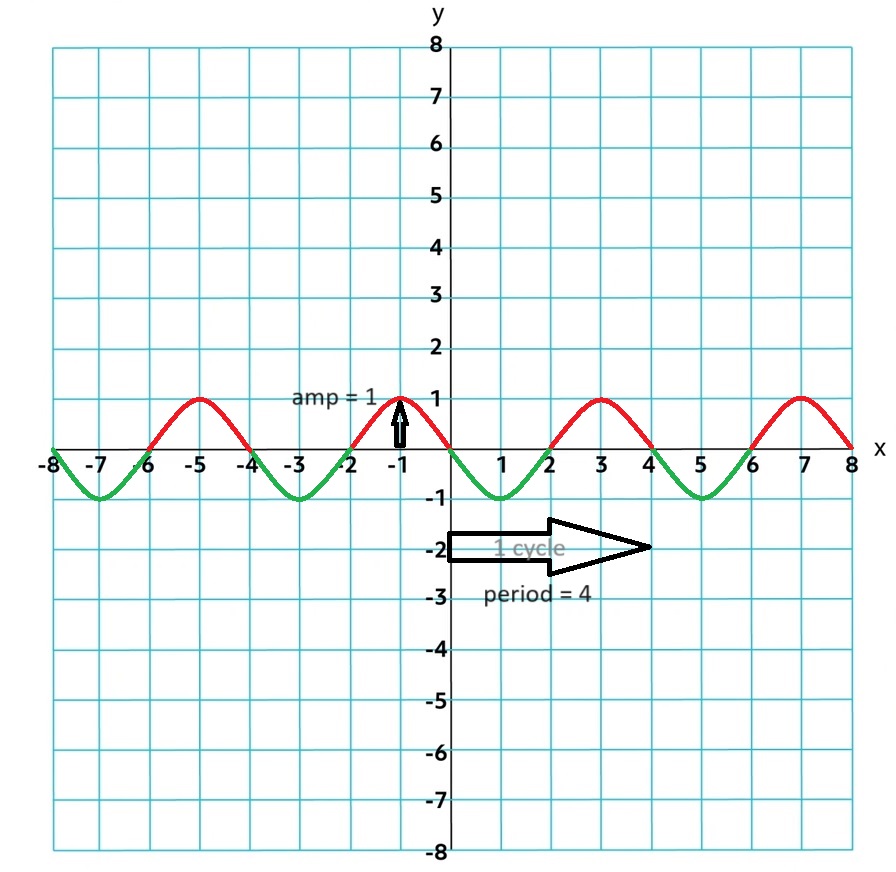
Periodic Function: any function that repeats its values ona regular interval, periods, such as breathing, heartbeat, or waves. Can be graphed from the graph of a single cycle.
Cycle: one complete pattern of the y-values for a periodic function
Period: the horizontal length of one cylce for a periodic or repeating function
Amplitude: half the difference between the maximum and minimum values for the function.
Amplitude = 1⁄2|max - min|
3.1.B
f(x + nk) = f(x) for all values of x in the domain. k is the period of the function and completely determines the behavior of the function.
You can find the period by finding where the pattern begins to repeat over successive equal-length output values.
Periodic functions take on characteristics of other functions, such as intervals of increase and decrease, different concavities, and various rates of change. However, every feature found in the first period will be in every period of the function.
3.2 Sine, Cosine, Tangent
3.2.A
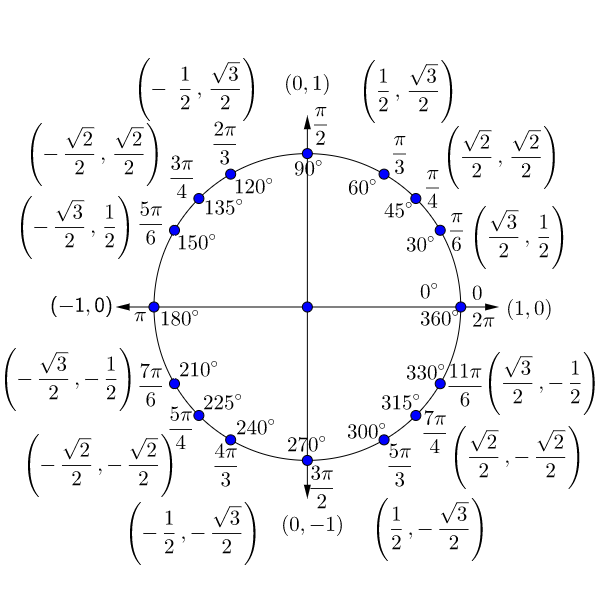
MEMORIZE AND KNOW THE UNIT CIRCLE BY HEART!!!*to make your life easy
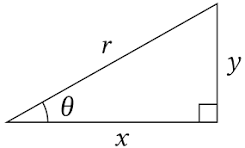
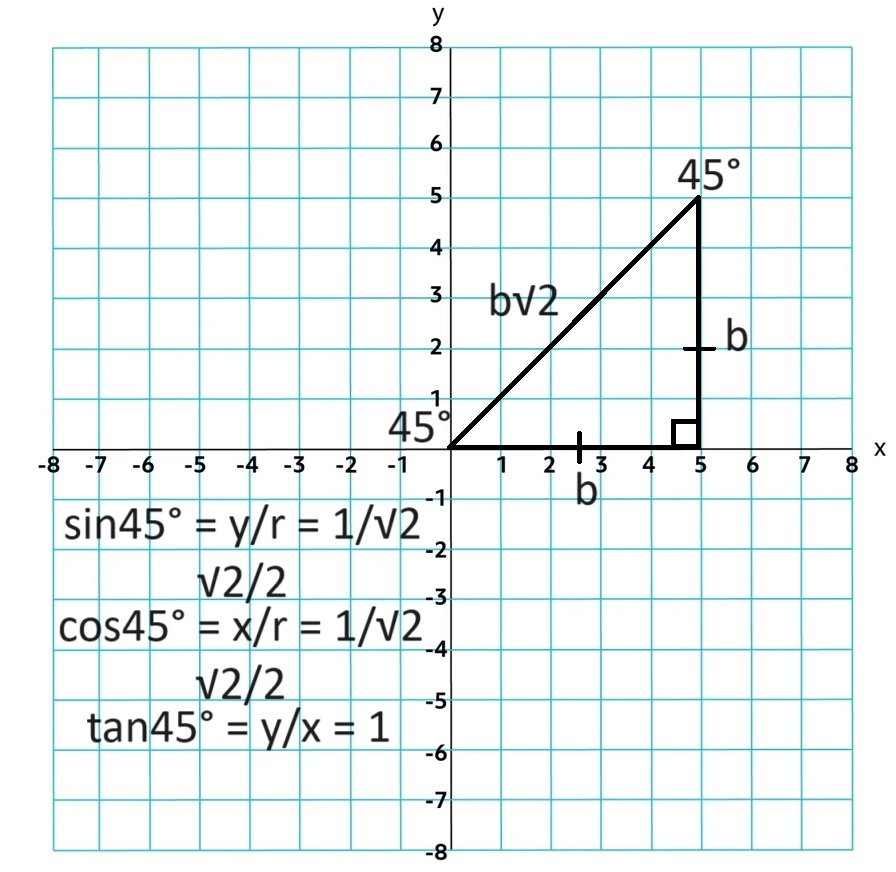
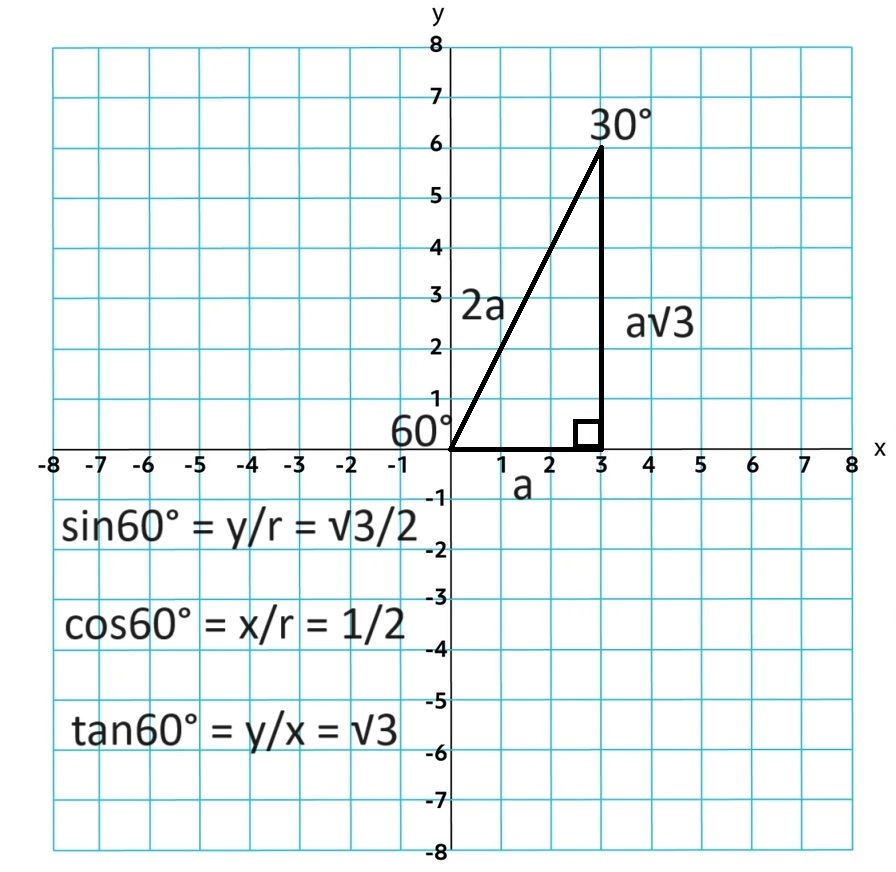
Sine = sinθ = y⁄r
Cosine = cosθ = x⁄r
Tangent = tanθ = y⁄x
Sine is y displacement
Cosine is x displacement
tangent is the slope: sinθ⁄cosθ
3.3 Sine and Cosine Function Values & 3.4 Graphs
Given the measure of θ in standard position and a circle with a radius r centered as the orgin where point P is a ray intersecting with the circle. P can be defined as (r cosθ, r sinθ)
You can use multiples of π⁄4 and π⁄6 and can be found using definitions of special right triangles
π⁄6
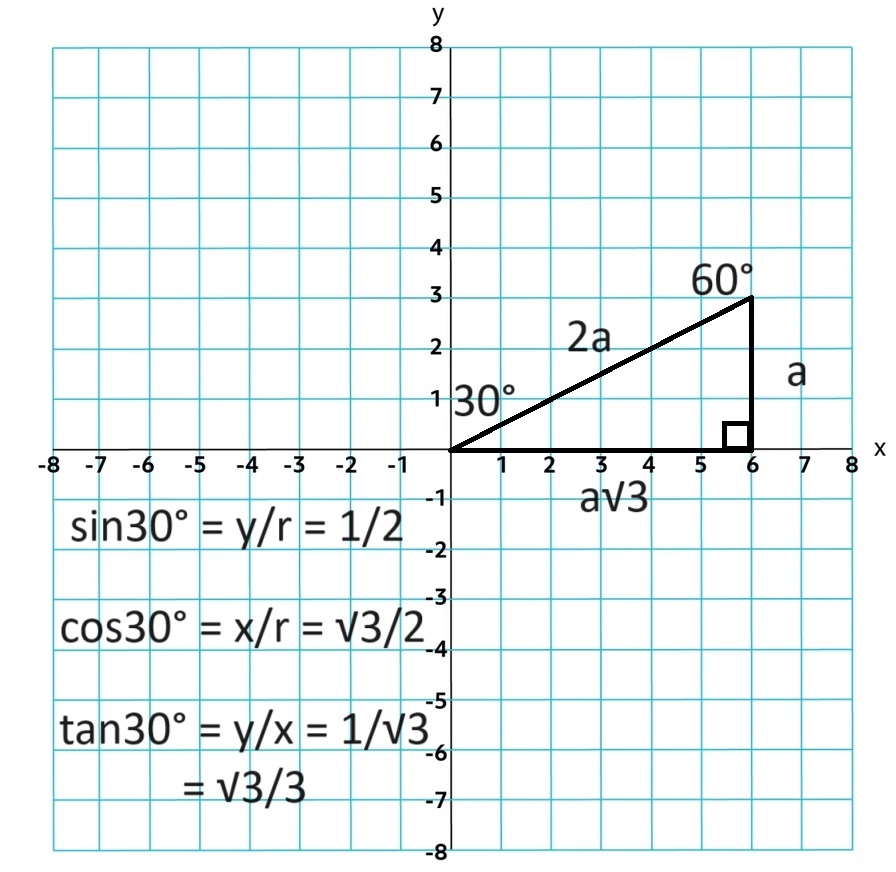
π⁄4
π⁄3
3.5 Sinusoidal Functions
3.5.A
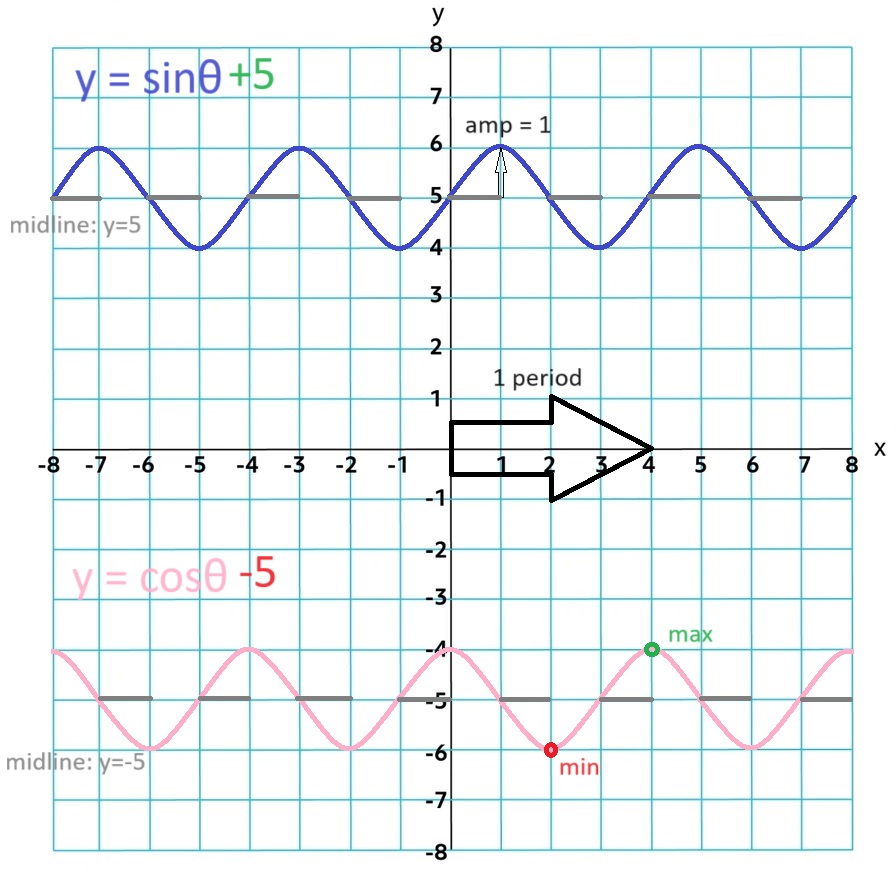
Sine and Cosine Functions are sinsusoidal functions. cos θ = sin(θ + π⁄2)
Period and Frequency are reciprocals. The peoiod of f(θ) = sinθ and
g(θ) = cosθ is
Period: 2π⁄b
Frequency: b⁄2π
Amplitude: half the distance between the max and min values. The amplitude of f(θ) = sinθ and g(θ) = cosθ is 1.
1⁄2|max-min|
Midline: determined by the average between the maximum and minimum. The midline of y = sinθ and y = cosθ is y = 0.
1⁄2(max+min)
As input values increase, the sinusoidal function will osilate between concave up and down.
y = sinθ has rotational symmetry about the origin and y = cosθ has reflective symmetry over the y-axis.
3.6 Sinusoidal Function Transformations
3.6.A
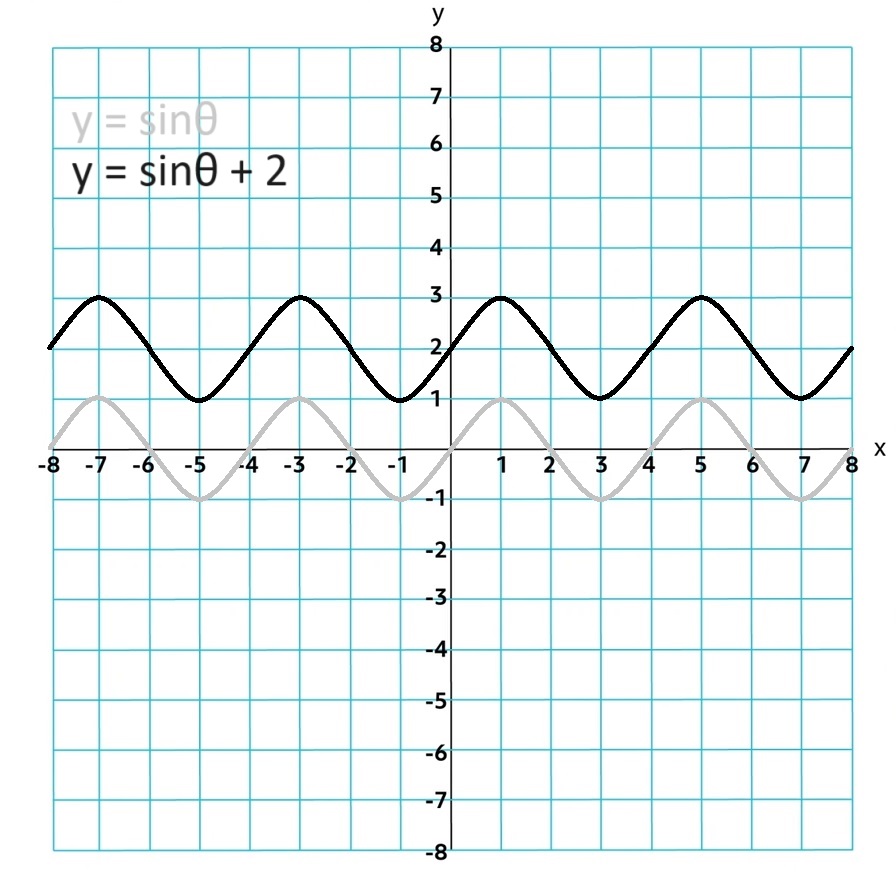
Sinusoidal Function form f(θ) = a sin(b(θ + c)) + d or g(θ) = a cos(b(θ + c)) + d
Vertical Shift = d
sin θ + d
Horizontal Shift = -c
sin(θ + c)
.jpg)
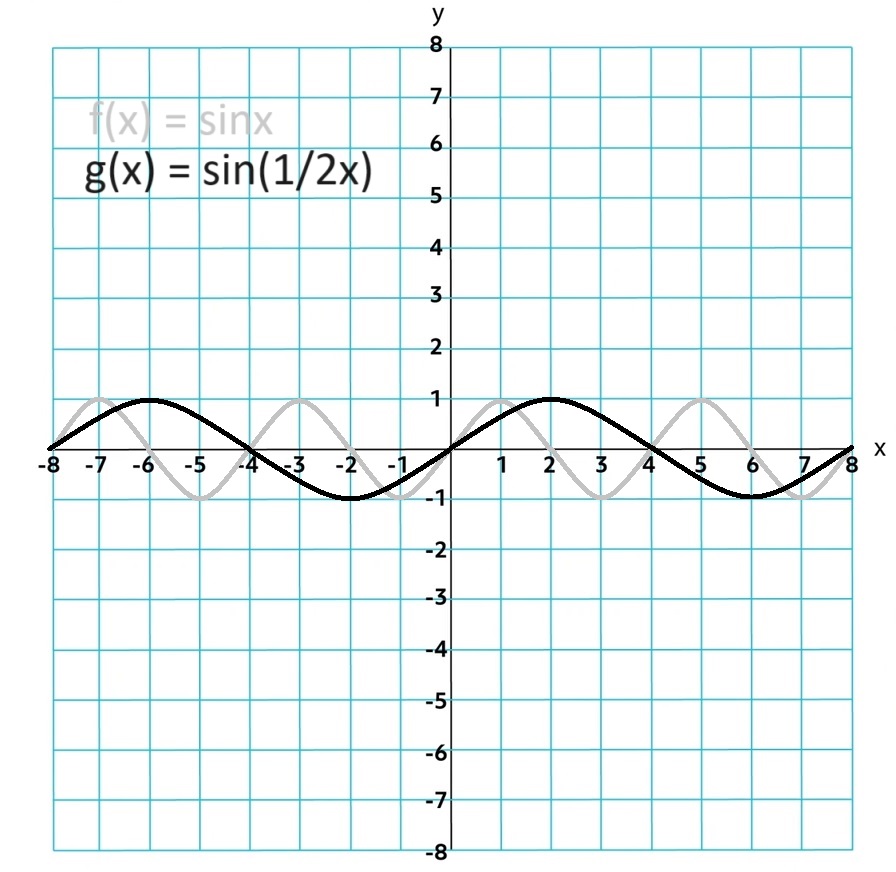
Horizontal Dilation = b
Period = 2π⁄b
sin bθ
If b < 0 then there is a reflection over the y-axis
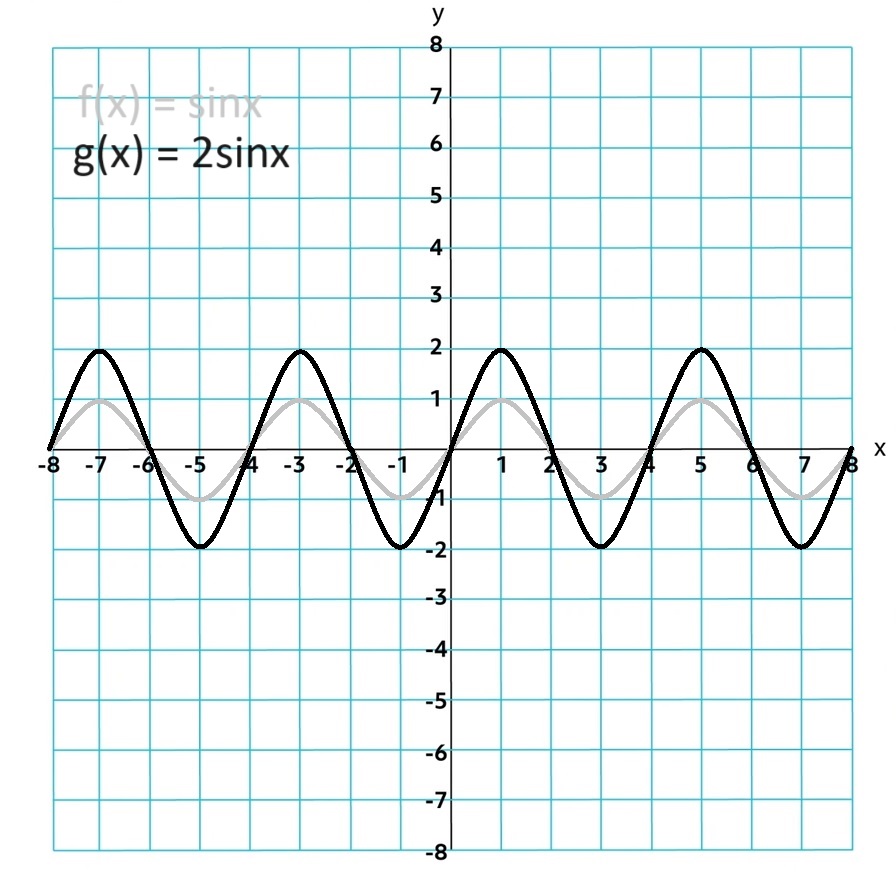
Amplidue = |a|
a sin θ
If a < 0 then there is a reflection over the x-axis
3.7 Sinusoidal Function Context and Data Modeling
3.7.A
Period and Frequency can be found by finding the distance between two maximums or two minimums
The distance between the maximum and minimum output values can be used to determine the amplitude and vertical shift
An parit of input output calues can be compared to determine the phase shift of the function.
You can use data and plug it into technology to get a sinusoidal regression.
You can use sin reg in your calculator
1. stat → edit
2. fill out the L1(x) and L2(y)
3. stat → calc → sin reg
4. go to y= and y1
5. vars → Statistics → EQ → RegEQ
The functions can be used to find the dependent variable from the independent variable.
3.8 The Tangent Function
3.8.A
f(θ) = tanθ gives the slope of the termial ray to the point P on the unit circle
Since tanθ is the ratio of change in y over change in x, tanθ = sinθ⁄cosθ
3.8.B
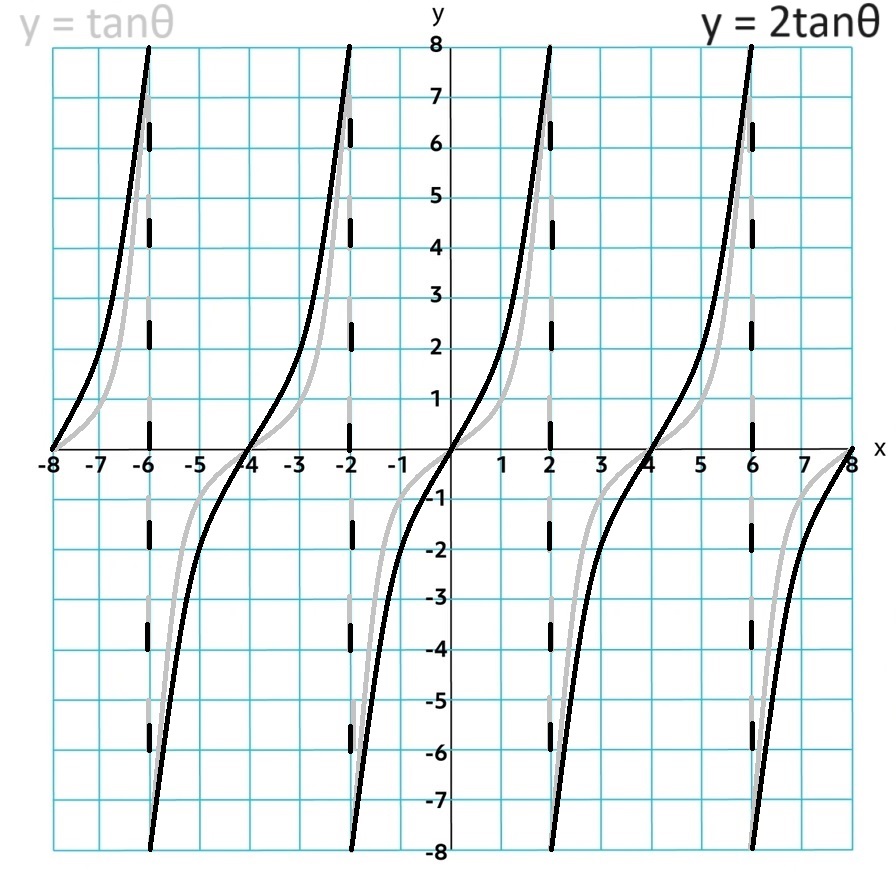
Because the slops values repeat every half revolution, the period of the tangent
function is
The assymptotes are vertical and occur at θ =
π⁄2 +
k
3.8.C
Tangent Function form f(θ) = a tan(b(θ + c)) + d
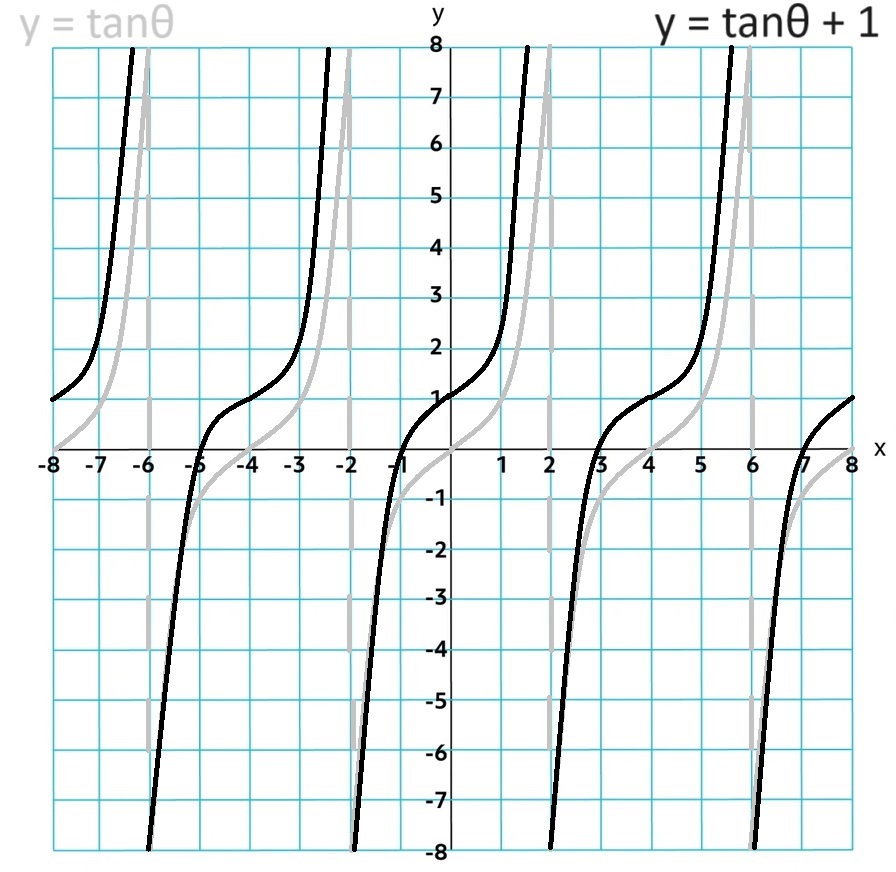
Vertical Shift = d
tan θ + d
Horizontal Shift = -c
tan(θ + c)
.jpg)
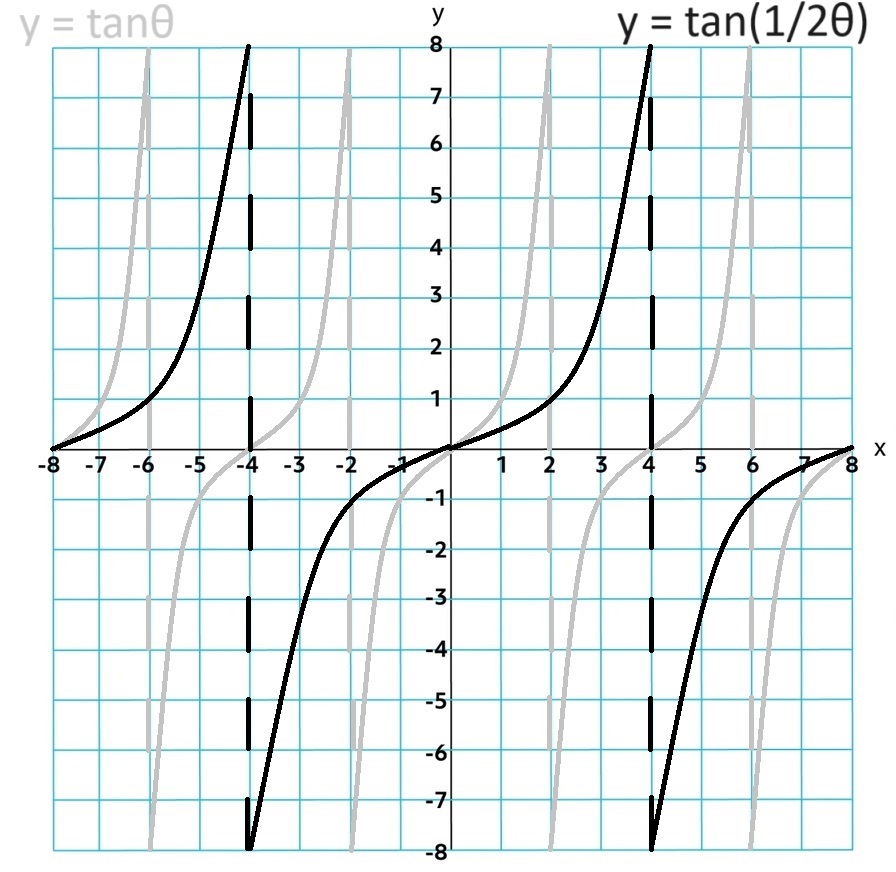
Horizontal Dilation = b
Period = π⁄b
tan bθ
If b < 0 then there is a reflection over the y-axis
Amplidue = |a|
a tan θ
If a < 0 then there is a reflection over the x-axis
3.9 Inverse Trigonometric Functions
3.9.A
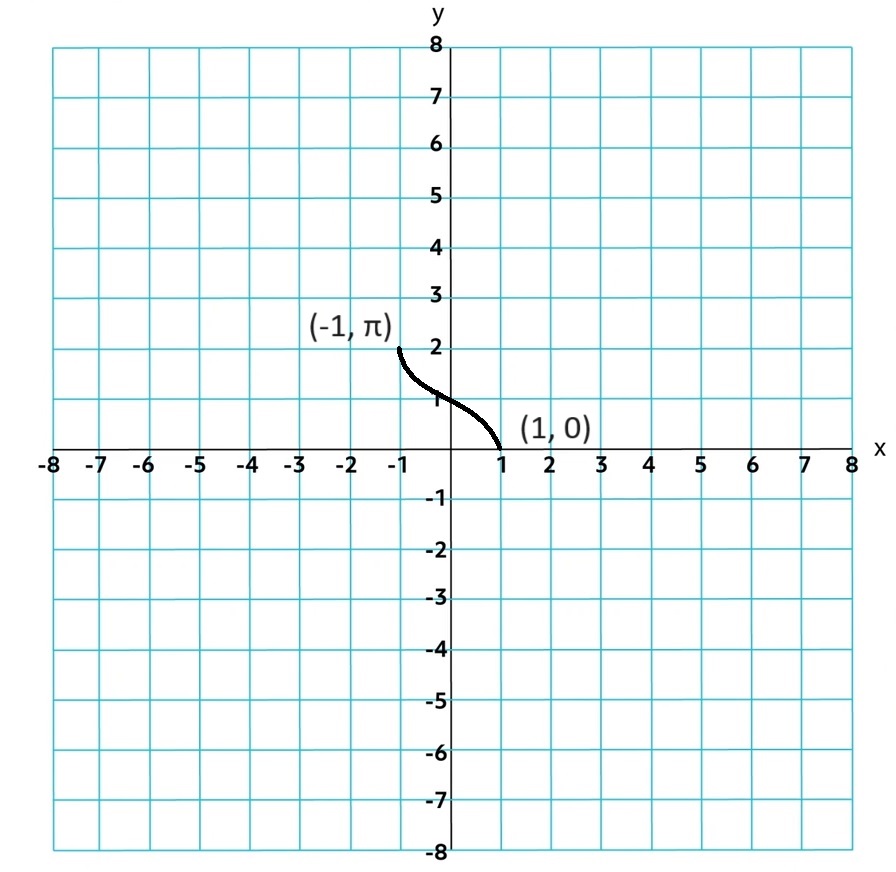
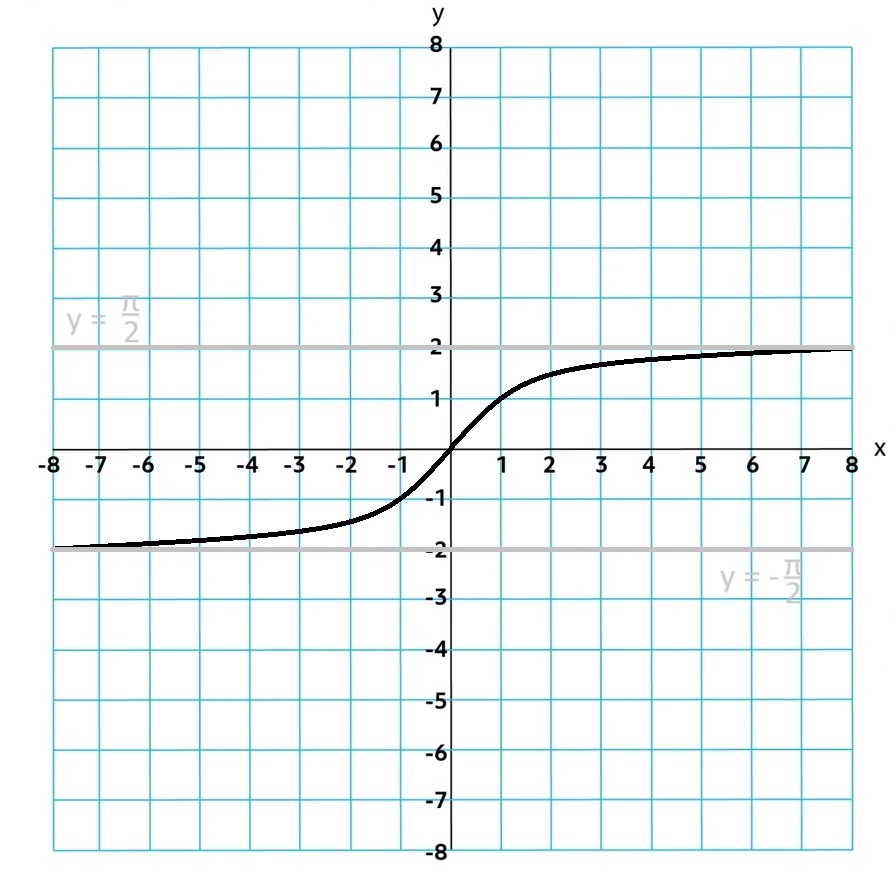
For inverse trigonometric functions, the input and ouput values are switchsed.
The inverse function is written as arcsine, arccosine, and arctangent or sin-1, cos-1, and tan-1.
!!IMPORTANT!! these functions are only invertible on a restricted domain!!!
Sin needs to be restricted to [-π⁄2, π⁄2]
, cosine function [0,sin-1x

cos-1x
tan-1x
3.10 Trigonometric Equations and Inequalities
Inverse Trignometric funcions are useful in solving equations, but solutions may need restricted domains due to modifications.
ex. tanx = y and tan-1y = x
The Domain Restrictions can be implied by the context, which limits the number of solutions!!!
3.11 The Secant, Cosecant, and Cotangent Functions
Secant Function, f(θ) = secθ, where cosθ ≠ 0
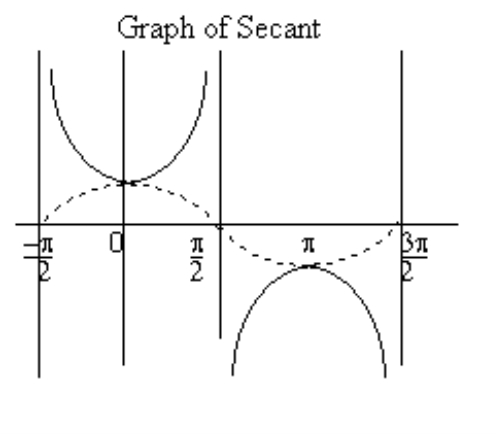
Cosecant Function, f(θ) = cscθ, where sinθ ≠ 0
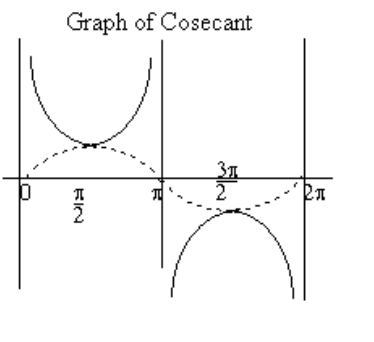
These functions have vertical assymptotes where cosine and sine = 0 with a range of (-∞,-1] ∪ [1, ∞)
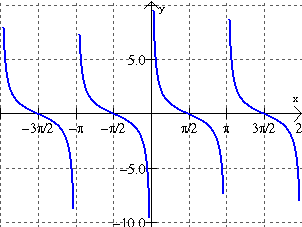
Cotangent Function: f(θ) = cotθ, where tanθ ≠ 0. Equivalently, cotθ = cosθ⁄sinθ, where sinθ ≠ 0
The cotangent function has vertical assyptotes where tanθ
3.12 Equivalent Representations of Trigonometric Functions
Reciprocal identities: sin x = 1⁄csc x ; csc x = 1⁄sin x cos x = 1⁄sec x ; sec x = 1⁄cos x tan x = 1⁄cot x ; cot x = 1⁄tan x
Even-Odd Identities sin -x = -sin x ; csc -x = -csc x cos -x = cos x ; sec -x = sec x tan -x = -tan x ; cot -x = -cot x
Quotient Identites tan x = sin x⁄cos x cot x = cos x⁄sin x
Pythagorean identities: sin2θ + cos2θ = 1 tan2θ + 1 = sec2θ cot2θ + 1 = csc2θ
Sum and Difference Formulas cos(α + β) = cosαcosβ - sinαsinβ cos(α - β) = cosαcosβ + sinαsinβ sin(α + β) = sinαcosβ + cosαsinβ sin(α - β) = sinαcosβ - cosαsinβ tan(α + β) = tanα + tanβ⁄1 - tanαtanβ tan(α - β) = tanα - tanβ⁄1 + tanαtanβ
Double-Angle Formulas sin2θ = 2sinθcosθ cos2θ = cos2θ - sin2θ cos2θ = 2cos2θ - 1 cos2θ = 1 - 2sin2θ tan2θ = 2tanθ⁄1 - tan2θ
Cofunction Identities sin(π⁄2 - θ) = cos θ cos(π⁄2 - θ) = sin θ tan(π⁄2 - θ) = cot θ cot(π⁄2 - θ) = tan θ sec(π⁄2 - θ) = csc θ csc(π⁄2 - θ) = sec θ
3.13 Trigonometry and 2 Polar Coordinates
Polar coordinates are in the form (r, θ)
Convert Polar to Rectangular (x, y) using x = rcosθ and y = rsinθ.
Convert Rectangular to Polar (r, θ) using r2 = x2 + y2
and θ = arctan(y⁄x) for x > 0 or
θ = arctan(y⁄x) +
Complex Number: for (a, b) is expressed as a + bi for rectangular but for polar coordinates (r, θ) is expressed as (r cosθ) + i(r sinθ)
3.14 Polar Function Graphs
The graph of the Polar function r = f(θ) consists of input-output pairs where input values are angles in radians and the ouput are radii.
The domain can be restricted by seleting endpoints of cooresponding angles and radii.
Changes in the input values coorespond to changes in output values in accordance to distance away from the orgin.
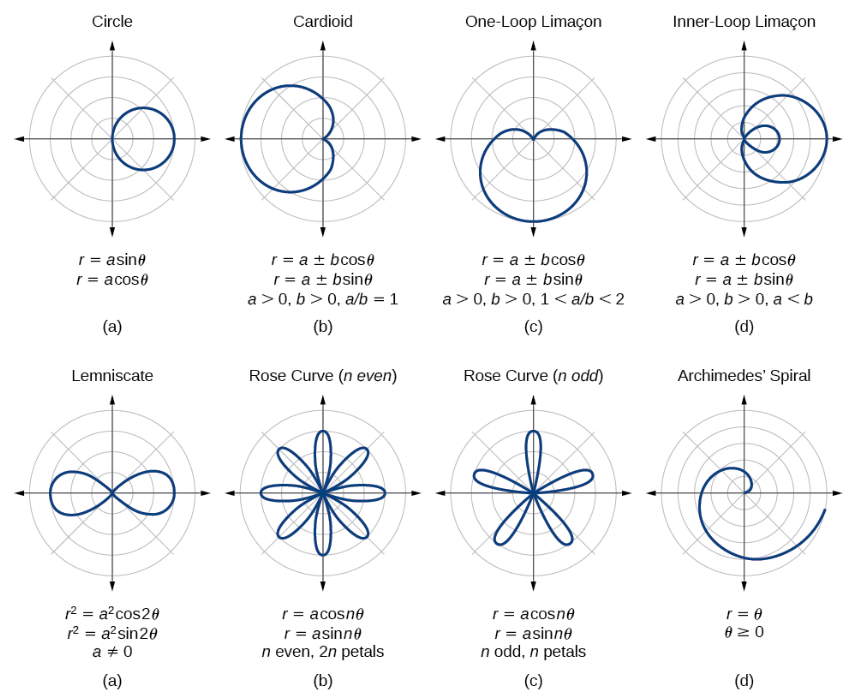
sine functions will be on the positive or negative y axis and have symmetry across the line y = π⁄2 while cosine function will be on the positive or negative x axis and hae symmetry across the polar axis.
3.15 Rates of Change in Polar Functions
If the polar function r = f(θ), is positive and increasing or negative and decreasing, then the distance between f(θ) and the orgin is increasing.
If the polar function r = f(θ), is positive and decreasing or negative and increasing, then the distance between f(θ) and the orgin is decreasing.
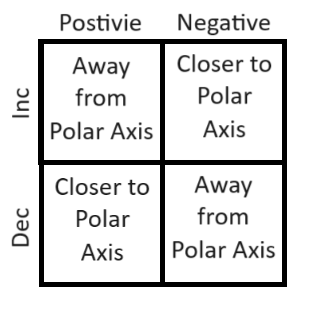
If the function changes from increasing to decreasing or decreasing to increasing on an interval, then there is a relative extremum on the interval to a point either closest or farthest from the orgin.
The Average rate of Change of r with respect to θ indicates the change at which the radius is changing per radian. This value can be used to estimate values of the function within the interval
!TIP! Graph the function on a (x, y) graph in order to help solve these problems !TIP!